
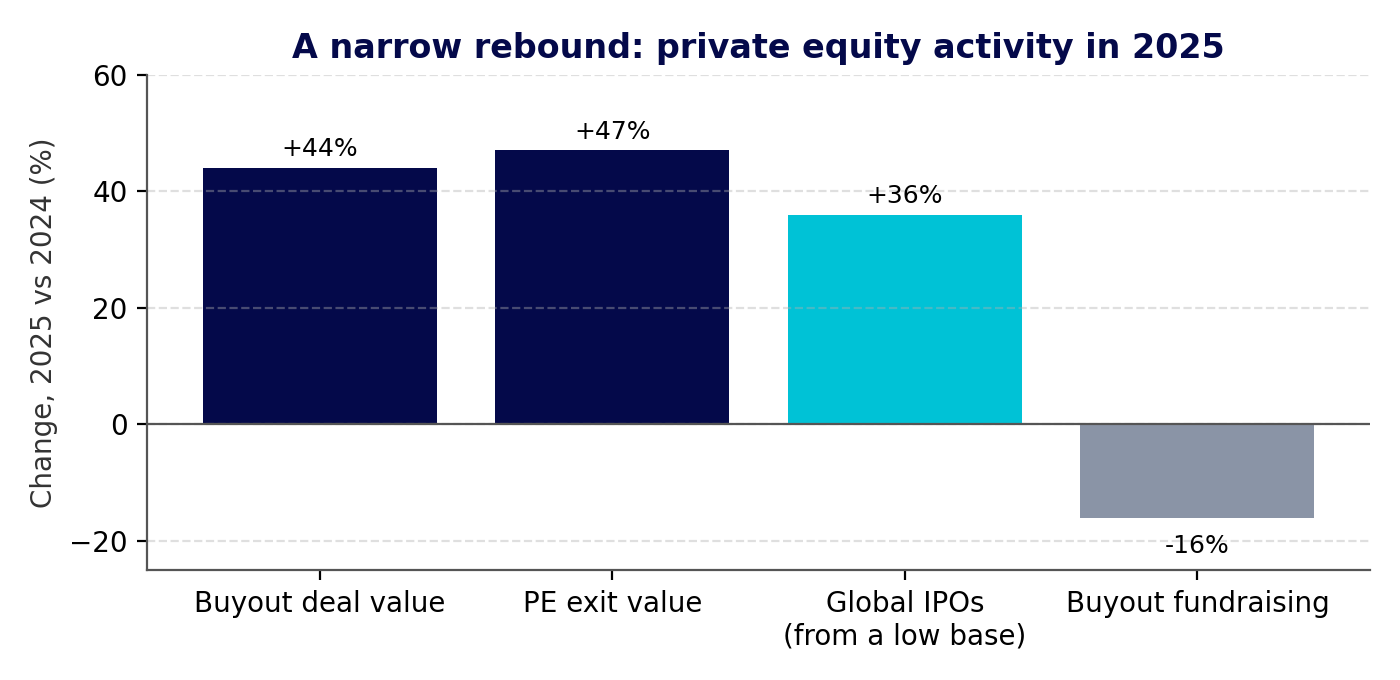
Activity rebounded in 2025 — buyout deal value rose 44% and exit value 47% — but the recovery was concentrated in larger, higher-quality assets (Bain).
Distributions stayed at about 14% of NAV, below 15% for a fourth consecutive year.
Pricing reflects the split: buyout LP portfolios averaged 92% of NAV in 2025 against 78% for venture and growth (Jefferies).
The phrase “K-shaped recovery” has become shorthand for a private market in which averages conceal two very different experiences. The 2025 data support the description, though not always in the way the phrase is used.
The rebound was real, and narrow
Bain & Company's Global Private Equity Report 2026 records a clear recovery in activity: buyout deal value rose 44% to about US$904 billion and exit value rose 47% to US$717 billion, with sponsor-backed IPOs up 36% from a depressed base [1]. Buyout fundraising, however, fell 16%, and capital continued to concentrate among the largest managers [1].
Figure 1: A narrow rebound — private equity activity in 2025 versus 2024
Source: Bain & Company, Global Private Equity Report 2026 (23 Feb 2026) [1]. Chart: Argent Bluebook.
Liquidity is still the binding constraint
Distributions to limited partners remained at roughly 14% of net asset value in 2025, below 15% for a fourth consecutive year — an industry record [1]. McKinsey's parallel analysis notes that continuation vehicles now account for an estimated 14% of sponsor-backed exits, and that about 30% of limited partners surveyed regard assets moved into those vehicles as distressed or challenged [2]. Slow distributions are what push otherwise unwilling sellers into the secondary market.
Pricing shows the divergence
Secondary pricing is the clearest expression of the split. Jefferies reported average 2025 LP portfolio pricing of 92% of NAV for buyout against 78% for venture and growth [3]. The gap reflects both the underlying risk and the depth of the buyer pool: dedicated capital for diversified buyout portfolios is abundant, while venture portfolios face a narrower set of buyers.
The software reset sharpened the line
Early 2026 added a further test. A wave of agentic AI product launches prompted investors to reassess software business models, and listed software sold off; J.P. Morgan Asset Management noted that the S&P BDC index fell to a year-to-date low on 5 February as investors trimmed exposure to private credit funds lending to software companies [4]. For private portfolios, the effect is felt first through comparables and then, with a lag, through marks.
What separates the arms of the K
Three characteristics recur among assets trading near par: demonstrable revenue growth, a defensible position in a market that AI is expanding rather than compressing, and a capital structure that does not depend on refinancing at lower rates. Assets lacking those characteristics are not simply cheaper; in many cases they do not trade at all, which is why reported average discounts understate the dispersion.
Reading the averages carefully
Two practical cautions follow. Headline volume growth reflects, in part, sellers accepting prices they would have rejected in 2021, so volume is not by itself evidence of health. And an average price of 90% of NAV describes a distribution with substantial weight at both ends rather than a market clustered near that level. In a bifurcated market, the average is the least informative number available.